In recent years, the success and growing popularity of car sharing apps have caused a number of different topics for arguments in society. In this article we analyse profitability of car sharing on several examples from the driver's point of view.
The given examples are valid for the chosen vehicles, taking into account the price level, age and mileage. These affect insurance premiums, expected avg fuel consumption, definitely servicing cost and one other very important element - price depreciation based on mileage.
The article's date fuel and other prices in Tallinn (Estonia) were used in the analysis.
The averages used in the analysis are meant for annual activity, presuming driving continuously over the year on average 5.5 days in a week.
Own car part-time (3,5-4 hours a day)
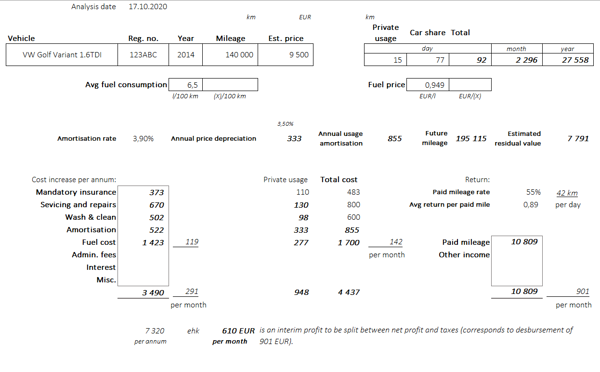
In the given example is presumed that the person drives for personal purposes on avg 15 km a day and 77 km with car sharing 3.5-4 hours a day, total avg mileage 92 km a day and total 27,558 km per annum. VW Golf Variant 1.6TDI; 2014; 140,000 km; estimated price 9,500 EUR
Annual cost:
373 – additional mandatory insurance premiums
670 – additional servicing cost
502 – wash & clean
522 – depreciation
1,423 – fuel (avg cons. 6.5 l/100 km; price 0.949 EUR/l)
3,490 – total given costs
10,809 – return from car sharing
Accounting for return we used a rate of paid miles of 55%, meaning that for every 5.5 km driven with a customer (paid miles) there is 4.5 km driving to the client and other unpaid mileage. The return is computed based on a rate of return per paid mile of 0.89 EUR after app's commission.
7,320 per annum or 610 EUR per month is an interim profit to be split between net profit and taxes (corresponds to payout after commission of 901 EUR).
Own car full-time (8-9 hours a day)
In the given example is presumed that the person drives for personal purposes on avg 15 km a day and with car sharing 179 km over 8-9 hrs a day, total avg mileage 194 km a day and total 56,810 km per annum.
VW Golf Variant 1.6TDI ; 2014; 140,000 km; estimated price 9,500 EUR
Annual cost:
373 – additional mandatory insurance premiums
1,384 – additional servicing cost
923 – wash & clean
1,610 – depreciation
3,233 – fuel (avg cons. 6.5 l/100 km; price 1.28 EUR/l)
7,523 – total given costs
25,128 – return from car sharing
Accounting for return we used a rate of paid miles of 55%, meaning that for every 5.5 km driven with a customer (paid miles) there is 4.5 km driving to the client and other unpaid mileage. The return is computed based on a rate of return per paid mile of 0.89 EUR after app's commission.
17,606 per annum or 1,467 EUR per month is an interim profit to be split between net profit and taxes (corresponds to payout after commission of 2 094 EUR).
Rental car full-time (12 hours a day)
In the given example is presumed that the person drives for personal purposes on avg 15 km a day and with car sharing 252 km over 12 hrs a day, total avg mileage 267 km a day and total 77,745 km per annum.
VW Golf Variant (petrol + cng)
Annual cost:
11,361 – rental cost
1,133 – wash & clean
2,178 – fuel (avg cons. 0.22 l/100 km for 1.229 EUR/l + 4.5 kg/100 km for 0.599 EUR/kg)
14,672 – total given costs
35,376 – return from car sharing
Accounting for return we used a rate of paid miles of 55%, meaning that for every 5.5 km driven with a customer (paid miles) there is 4.5 km driving to the client and other unpaid mileage. The return is computed based on a rate of return per paid mile of 0.89 EUR after app's commission.
20,704 per annum or 1,725 EUR per month is an interim profit to be split between net profit and taxes (corresponds to payout after commission and rent of 2 001 EUR).
